Mastering the Five Sector Pie Chart Slide Template: A Complete Guide to Visualizing Data with Precision and Creativity
In an era where data drives nearly every decision, the ability to present information clearly and memorably has become a non-negotiable skill. We live surrounded by statistics, percentages, and analytical reports that, when left raw, can overwhelm even the most attentive audience. Enter the Five Sector Pie Chart Slide Template—a deceptively simple yet remarkably powerful tool that transforms numerical complexity into visual harmony. Whether you are preparing a quarterly business review, designing an educational infographic, or crafting a compelling pitch deck, this template offers a bridge between cold data and human understanding. But what exactly makes a five-sector pie chart so effective, and how can you harness its full potential in your own presentations? This article explores every facet of the topic, from foundational design principles to advanced storytelling techniques, ensuring you walk away with actionable insights that elevate your communication game.
Understanding the Anatomy of a Five Sector Pie Chart
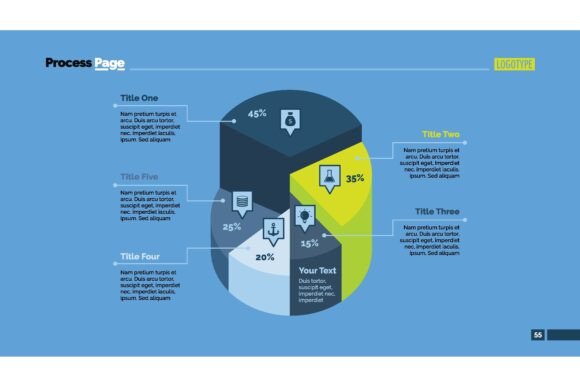
At its most basic level, a pie chart is a circular statistical graphic divided into slices that illustrate numerical proportion. The arc length of each slice—and consequently its central angle and area—corresponds to the quantity it represents. In a Five Sector Pie Chart, the circle is divided into exactly five distinct segments, each representing a portion of a whole that collectively sums to 100 percent. This configuration occupies a sweet spot in data visualization: it offers enough granularity to convey meaningful breakdowns without veering into the clutter that plagues charts with too many categories.
The anatomy of this chart type is elegantly straightforward. Five sectors radiate from the center, separated by clean lines or slight gaps depending on the design language of the slide template. Each sector carries a label, often accompanied by a percentage value, an icon, or a short descriptor. The surrounding white space, color choices, and typography all contribute to how quickly the viewer processes the information. Modern slide templates elevate this basic structure by integrating contemporary design elements—subtle shadows, gradient fills, or even three-dimensional extrusion effects—that catch the eye without sacrificing readability.
The Psychological Power of Five
Why five sectors rather than four or six? The number five holds a unique cognitive appeal. Psychological research suggests that the human brain can comfortably hold around five to seven chunks of information in working memory at once—a principle famously articulated by cognitive psychologist George A. Miller. A five-sector pie chart aligns perfectly with this natural threshold, making it easier for audiences to absorb, retain, and recall the information being presented. When you display four sectors, the chart sometimes feels too simplistic for nuanced data; when you push to seven or eight, the slices become thin and difficult to differentiate. Five sectors strike an ideal balance, providing a comprehensive snapshot without demanding excessive cognitive effort from the viewer.
The Role of Slide Templates in Modern Data Presentation
Slide templates have evolved far beyond the generic, bullet-point-laden defaults of early presentation software. Today's professionally designed templates embody principles of visual hierarchy, color theory, and narrative flow that most users would struggle to replicate from scratch. The Five Sector Pie Chart Slide Template exemplifies this evolution, offering a ready-made graphic that can be dropped into a presentation and customized within minutes. For business professionals juggling tight deadlines, such templates are not merely convenient—they are strategic assets that ensure consistency, polish, and persuasive power across every slide.
What sets a high-quality template apart is its attention to versatility. A well-constructed five-sector pie chart template might include variations: a flat design version for minimalist presentations, a three-dimensional rendition for added visual impact, or an icon-integrated layout that pairs each sector with a representative symbol. Some templates even feature animation capabilities, allowing sectors to appear sequentially during a live presentation, guiding the audience through the data step by step. This layered approach transforms a static chart into an interactive storytelling device that unfolds in real time.
Practical Applications Across Industries
The beauty of the five-sector pie chart lies in its universality. Its applications span virtually every sector of the economy and all manner of communication contexts. Below are several concrete examples that illustrate how different fields leverage this visualization format to solve real-world communication challenges.
Business and Finance
In corporate environments, the five-sector pie chart frequently appears in annual reports, investor presentations, and budget breakdowns. A chief financial officer might use one to display a company's revenue distribution across five product lines, while a marketing director could illustrate how the department's budget is allocated among content creation, paid advertising, events, tools, and personnel. The immediacy of the visual allows stakeholders to grasp proportional relationships at a glance—instantly revealing, for instance, whether investments in research and development are keeping pace with strategic goals.
Education and Academic Research
Educators and researchers rely on pie charts to communicate findings in accessible ways. A university professor teaching introductory statistics might employ a five-sector chart to break down survey responses into five demographic categories. In academic papers and conference posters, these charts serve as quick-reference summaries that complement dense methodological text. The best educational slide templates include ample space for annotations, allowing presenters to add explanatory notes without overcrowding the visual core.
Healthcare and Public Policy
Healthcare administrators and public health officials often turn to five-sector pie charts when presenting epidemiological data or hospital resource allocation. For example, a slide might show how a public health budget is partitioned among vaccination programs, maternal care, mental health services, infrastructure, and emergency preparedness. The clarity of the format supports transparent communication with both expert and lay audiences, fostering informed decision-making at every level.
Technology and Product Development
In the tech world, product managers use pie charts to visualize user segmentation, feature adoption rates, or bug report categories. A five-sector breakdown might reveal that 45 percent of customer feedback relates to usability, 25 percent to performance, 15 percent to security, 10 percent to integrations, and 5 percent to design. This segmentation directly informs prioritization in the product roadmap, making the chart not just a reporting tool but a decision-making instrument.
Design Principles That Make a Five Sector Pie Chart Shine
Creating an effective pie chart requires more than just plugging numbers into a template. Certain design principles distinguish a chart that communicates instantly from one that leaves the audience squinting and confused. Understanding these principles empowers you to customize any Five Sector Pie Chart Slide Template with confidence and intentionality.
Color Selection and Contrast
Color is arguably the most influential design element in a pie chart. The five sectors must be visually distinct from one another, which necessitates a palette of hues with sufficient contrast. Professional templates often employ complementary or analogous color schemes that are aesthetically pleasing while maintaining clear differentiation. Avoid using shades that are too similar, such as five slightly varied blues, unless the design intentionally groups certain categories. For accessibility, ensure that color is not the sole differentiator; consider adding patterns, labels, or varying levels of saturation to accommodate color-blind viewers.
Labeling and Readability
Labels anchor the abstract shapes of the chart to concrete meaning. In a five-sector layout, there is typically enough room to place category names and percentage values directly on or adjacent to each slice. Some templates favor a legend-based approach, where colored swatches beside the chart key the viewer to each segment. Choose whichever style suits your content density—but never sacrifice legibility for style. Font sizes should remain readable even when projected onto a large screen, and text color should contrast sharply with background tones.
Sorting and Logical Order
The sequence in which sectors appear influences perception. A common best practice is to arrange slices in descending order of magnitude, starting from the largest segment at the 12 o'clock position and moving clockwise. This establishes a visual rhythm that feels orderly and intuitive. Alternatively, if your categories have a natural sequence—such as stages in a process or steps in a funnel—maintaining that chronological order can reinforce the narrative structure of your presentation.
Common Misunderstandings and Pitfalls to Avoid
Despite its apparent simplicity, the pie chart is one of the most frequently misused chart types in data visualization. Understanding these pitfalls helps you avoid amateur mistakes that can undermine your credibility and confuse your audience.
Using pie charts for data that does not sum to a meaningful whole is a foundational error. Pie charts represent parts of a total, so if your five categories do not collectively account for 100 percent of something, the graphic is inherently misleading. Always verify that your dataset is complete and that the categories are mutually exclusive.
Overloading the chart with too much detail is another common misstep. Even with only five slices, cramming in lengthy descriptions, multiple data points per sector, or excessive decorative elements can turn a clean visual into visual noise. Trust the simplicity of the format and relegate supplementary details to speaker notes or adjacent text blocks.
Distorting proportions through three-dimensional effects deserves particular caution. While 3D pie charts can look impressive, they skew the viewer's perception of area and angle, making it harder to gauge accurate proportions. A sector in the foreground may appear larger than an identically sized one tilted away from the viewer. If precision matters—and in most professional contexts it does—lean toward flat or subtly shaded designs that preserve proportional integrity.
How to Customize a Five Sector Pie Chart Slide Template for Maximum Impact
Customization is where a generic template becomes uniquely yours. Begin by identifying the story you want to tell. Are you highlighting a dominant segment that overshadows the others? Emphasize it with a bold, saturated color while keeping the remaining four sectors in softer, neutral tones. Are you showing a balanced distribution? Use five harmonious hues of equal visual weight to convey equilibrium. Every adjustment—from color and font to labeling and animation—should serve the narrative purpose.
Consider integrating icons or illustrations into each sector to reinforce categorical meaning. A dollar sign for budget items, a person icon for demographic segments, or a gear symbol for operational categories adds an immediate layer of recognition that text alone cannot match. Many premium templates include matching icon sets, streamlining this process.
Do not overlook the surrounding context on the slide. A five-sector pie chart rarely stands alone; it is typically accompanied by a headline, a subtitle, and perhaps a brief paragraph of analysis. Arrange these elements in a way that guides the eye naturally from the high-level takeaway to the detailed breakdown. The chart should anchor the slide, but the supporting text transforms data into actionable insight.
Integrating the Five Sector Pie Chart into a Broader Data Story
No chart exists in isolation. Within a presentation or report, the five-sector pie chart functions as one beat in a larger narrative arc. It might follow a slide that sets up the problem and precede one that outlines proposed solutions based on the data revealed. Effective presenters use the chart as a pivot point—a moment where abstract numbers crystallize into a clear picture that propels the story forward.
Imagine a marketing team presenting their annual review. They open with a headline about shifting customer preferences, then display a five-sector pie chart showing the breakdown of acquisition channels. The dominant slice reveals that social media now drives 50 percent of new customers, up from 30 percent the previous year. This visual revelation seamlessly transitions into a discussion of reallocated budget and new campaign strategies. Without the chart, the narrative would feel abstract; with it, the rationale becomes undeniable.
Why the Five Sector Pie Chart Slide Template Endures
In a world awash with complex dashboards, interactive data tools, and ever-evolving visualization techniques, the humble pie chart—and specifically the five-sector variant—retains its relevance for a simple reason: it works with human cognition rather than against it. The circular form mirrors natural cycles and proportions, feeling almost intuitive to our pattern-seeking brains. The limitation to five slices enforces discipline, compelling the creator to distill complexity into its essence. And the slide template format democratizes design excellence, allowing anyone with basic presentation software skills to produce professional-grade visuals that inform, persuade, and inspire.
As you explore the Five Sector Pie Chart Slide Template for your own projects, remember that its true value lies not in the graphic itself but in the clarity of thought it represents. Behind every well-designed chart is a careful process of selection, simplification, and storytelling. When you honor that process, your presentations will do more than display data—they will illuminate understanding and drive meaningful action.