Mastering Visual Data Storytelling with the United States Map Illustration Template
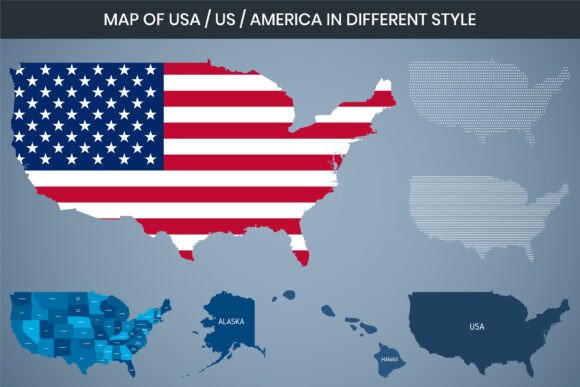
Every compelling presentation, detailed report, or marketing dashboard begins with a core asset: a visual anchor that grounds the viewer. For projects that involve regional analysis, demographic breakdowns, or geographic planning, a high-quality United States map illustration template serves as that foundation. It is not just an image; it is a versatile, editable resource designed to eliminate repetitive design work and accelerate the journey from raw data to a polished, narrative-driven graphic. This template, available as a colorful infographic map of the USA, transforms a blank canvas into a structured starting point, allowing you to focus on content rather than cartographic reconstruction.
The workflow advantage lies in the template’s immediate adaptability. You do not redraw state borders, adjust projection scales, or manually align Alaska and Hawaii inset boxes. Instead, you open a file, isolate the layers you need, and apply your data palette. For a marketer planning regional campaigns, that means dropping in performance metrics by state within minutes. For an educator building a lesson on climate zones, it means color-coding regions and adding labels without a cartography background. The template fits into the planning phase—right after you’ve gathered your data and before you finalize the layout of your slide deck, infographic, or printed poster.
Why a Pre-Built Editable US Map Changes Your Production Timeline
Traditional map creation often involves scanning low-resolution images, tracing outlines, or wrestling with online map generators that limit export quality. The United States map illustration template under discussion arrives with a 300 DPI resolution, built-in RGB color mode, and a laser cut design aesthetic—clean, crisp lines that maintain integrity at any zoom level. This is not just about prettier visuals; it’s about production efficiency. A resolution of 300 DPI means you can confidently place the graphic into both digital screens and printed brochures without pixelation. The laser cut style adds a modern, layered presentation feel, often sought after in corporate dashboards and infographics, reducing the need for time-consuming shadow or foam core effects.
Once you begin a new project, you often juggle multiple file formats. You might need an SVG for a web developer, an AI or EPS for a print designer, and a DXF for a physical laser engraver. The template’s included formats—AI, SVG, EPS, and DXF—cover these exact scenarios. This cross-compatibility means you can start your design in Adobe Illustrator, later hand it off to a Canva user without loss of editability, and finally export a crisp SVG for a responsive infographic. You are not locked into a single software ecosystem. The Canva editable attribute further streamlines collaboration with team members who don’t use professional vector tools, letting them tweak colors or text directly in a familiar interface before the asset goes live on social media or a presentation slide.
Integrating the Colorful USA Map into Your Data Visualization Workflow
Data without a visual frame is abstract. A colorful USA map infographic template acts as a heatmap canvas, a category separator, or an icon anchor. Think of a typical quarterly business review: you have sales numbers by territory. Instead of a table, you take the editable US map, group states into regions, and apply a gradient that immediately shows performance clusters. The process is straightforward: import the AI or SVG file, ungroup the states, and use your brand’s color palette. The template’s fully editable nature means every element—stroke weight, fill, label text, decorative dots—can be adjusted to match your style guide. This consistency reinforces brand identity across reports, and that kind of repetition builds professional trust with stakeholders.
For content creators and bloggers who need to illustrate a listicle or a how-to about state-specific regulations, the United States infographic template becomes a recurring asset. You create one master file in Illustrator, then duplicate artboards for each article topic. You might highlight all states with a certain law, add pin icons to major cities, or overlay travel routes. Because the base map lives as a scalable vector, you never worry about blurry lines when a reader zooms in on a mobile device. The process of repurposing the same map across multiple posts also maintains visual consistency and saves hours over a year of content production.
Preparing Your Workspace: Before You Open the File
Successful integration starts with a clear objective. Before you double-click the USA map vector file, decide what story you want to tell. Are you showing population density, election results, product distribution, or service coverage? This decision determines how you will manipulate the template. If you plan to use the United States Data Visualization approach, you’ll likely want to keep labels minimal and rely on a monochromatic or divergent color scale. If you’re building a travel-themed American Map Template, you might emphasize route lines and landmark icons that you’ll place on top of the base map.
Organize your data in a separate spreadsheet. With a clean dataset, you can map values to hex codes and then manually assign them in Illustrator or Canva. Some professionals take the extra step of labeling each state layer with its abbreviation in the Layers panel, ensuring that during the editing process, they don’t accidentally fill the wrong region. This small upfront organizational habit, combined with the logical layer structure often found in professional map templates, keeps the implementation smooth even for complex, multi-series infographics.
Designing with the Laser Cut and Colorful Infographic Aesthetic
The template’s Laser Cut Design and Colorful Infographic styles serve two different visual languages, but both fit within a modern workflow. The laser cut look simulates stacked, carved layers, often used in physical display boards or premium corporate reports. When you use this variant, think about contrast: a dark background with vibrant neon state fills creates a high-impact presentation cover. The technique of exporting each layer as a separate PNG or SVG and then animating them in a slide deck can also create a memorable reveal.
The colorful infographic template leans toward digital dashboards, social media graphics, and educational posters. Here, you can assign a unique color to every state or group by region. Avoid having more than 5–6 distinct colors unless each represents a discrete, labeled category; otherwise, the viewer struggles to decode the meaning. Integrate the map with additional data widgets—bar charts, icon stats, and percentage bubbles—around its perimeter. Because the map is a vector graphic, you can resize it to occupy as much or as little of the layout as needed without compromising the crispness of adjacent elements.
Ensuring Quality Control at 300 DPI and RGB Output
Resolution and color mode mistakes often surface only during final output, causing frustrating rework. Since this template is already set to RGB color mode, it’s optimized for screens—projectors, monitors, mobile devices, and digital signage. If you need to print, you can convert to CMYK inside your design application, but be aware that neon-like RGB colors may shift. To maintain visual punch in print, test a small swatch or select slightly subdued versions of vibrant hues. The 300 DPI resolution already gives you enough pixel density for sharp physical prints up to a large poster size, provided you don’t enlarge the rasterized exports beyond the original dimensions. When exporting for web, remember to use a 72 DPI setting, but keep the high-res master file untouched for future print needs.
For collaborative environments, version control is important. Keep one “master” template file in an AI or EPS format. When a team member needs to edit in Canva, export a copy or upload the SVG directly. Label your iterations by date or project phase. This way, the original United States map illustration template remains pristine, and any ad-hoc modifications can be traced back, rolled back, or merged. This workflow precaution prevents a situation where a marketer accidentally flattens layers needed by a designer weeks later.
Creative Applications That Extend Beyond Basic Map Usage
While most users think of infographic maps for regional data, the template also serves designers who create custom decision-making tools, travel itineraries, or even office wall art. A small business planning expansion might print the map on a large magnetic board and use color-coded pins; the crisp DXF file can be sent to a laser cutter to produce a wooden map base exactly matching the digital artwork. This fuses physical and digital workflows, reinforcing a cohesive brand experience from screen to real-world office environment.
Freelancers offering presentation design services can build a library of pre-customized US map illustrations for different clients. With the fully editable vector map, you can alter colors to match each client’s palette in minutes, create multiple state highlight combinations, and deliver a polished slide that fits into their template. This not only speeds up delivery but also allows you to offer a consistent “map style” that becomes part of your signature design language. Over time, you accumulate a repository of variations—blue-themed for a corporate bank, green for an environmental NGO, multi-colored for a startup pitch—all derived from the same original template, reducing repetitive asset hunting.
Vector Map USA Advantages for Scalable, Future-Proof Assets
Raster images become outdated quickly when screen resolutions improve or when a client requests a billboard design. A vector map USA like the SVG or AI versions provided scales infinitely: from a tiny website footer icon to a tradeshow backdrop spanning several feet. This flexibility means the asset is not a one-time use purchase but a long-term investment. When you create a scalable map infographic for an annual report, you can reuse the same base map the following year, updating only the data highlights, saving roughly 4–6 hours of initial layout work each cycle.
Similarly, if your organization’s branding guidelines evolve—perhaps a logo refresh or a shift in color palette—you can open the original AI file, make global color swaps, and re-export assets without losing any vector sharpness. The template remains compatible with future design software versions because AI and SVG standards are well-supported. EPS files, older but still valuable for legacy workflows, ensure compatibility with prepress systems. And DXF continues to be the standard for laser cutting and CNC machines, connecting your digital mapping efforts to tangible products like engraved awards, signage, or interactive puzzle maps.
Streamlining Team Collaboration and Client Handoffs
When multiple stakeholders contribute to an infographic project, a single source of truth prevents confusion. Place the editable US map template on a shared cloud drive or a design library. In applications like Adobe Creative Cloud Libraries or Canva Brand Kits, team members can access the approved file, ensuring that marketing, sales, and executive summaries use the same geographic base. This reduces the risk of a sales manager using a low-res, outdated screen-grab from a web search that misaligns state borders or misspells region names. The royalty-free USA map status also means no copyright concerns when the asset appears in public-facing materials, on products, or in online courses offered for sale.
Client handoffs become smoother as well. If you are a designer providing source files to a client, delivering an AI or SVG along with a standard EPS gives them freedom to edit without additional purchases. Explain the layer structure briefly; a one-page guide that points out where state groups, background layer, and text labels reside helps the client make minor updates themselves. This reduces dependency on you for small changes and builds client confidence. You can emphasize the high-resolution, print-ready nature of the template so they know it’s ready for any use case they might throw at it later.
Ultimately, a United States map illustration template functions as a foundational workflow tool. It slots in when raw information needs a clear, recognizable spatial framework. Whether you are creating a colorful USA map infographic for a quarterly social media report, designing a laser cut wooden map for a corporate gift, or building an interactive SVG for a web dashboard, the planning, preparation, and execution stages all benefit from a consistent, high-quality, and fully editable base. By integrating this asset into your toolkit, you standardize your visual geography, reduce design repetition, and open up creative possibilities that go far beyond a simple state outline.