Transform Your Data with Business Infographic Template V2
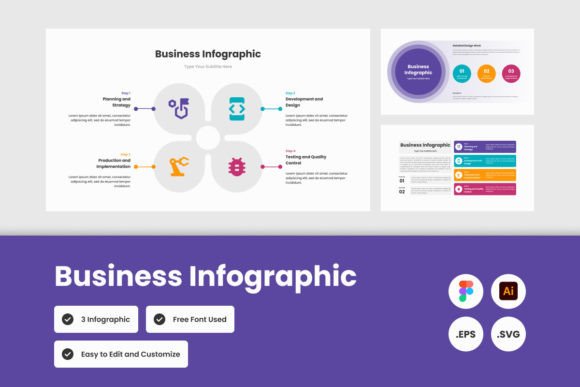
Every presentation deserves a visual language that speaks clearly. Business Infographic Template V2 does exactly that—it turns spreadsheets, quarterly numbers, and strategic roadmaps into something people actually want to look at. The moment you open one of the three included variations, you notice the intentional breathing room between elements, the restrained color palettes, and a layout rhythm that guides the eye without overwhelming it. There's no decorative clutter here. Every icon, chart component, and data point container has a reason for existing.
What sets this template apart is a kind of quiet confidence. The designers clearly understood that business audiences don't need visual fireworks—they need clarity with a dash of personality. The three unique designs give you different entry points depending on whether you're presenting to a startup team that appreciates bold contrast, a corporate board that expects polished minimalism, or a client pitch where approachable warmth matters. Across all variations, you'll find clean sans serif typography that prioritizes legibility at presentation scale, generous white space that prevents information overload, and color systems that feel contemporary without chasing design trends that'll look dated in six months.
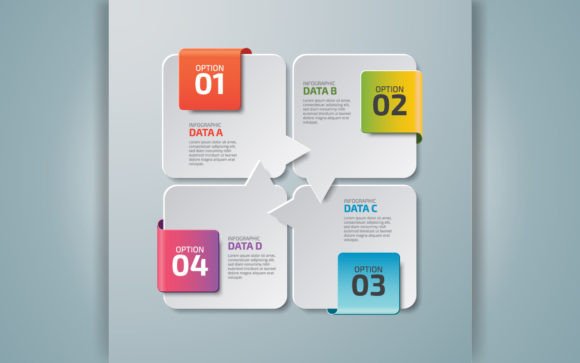
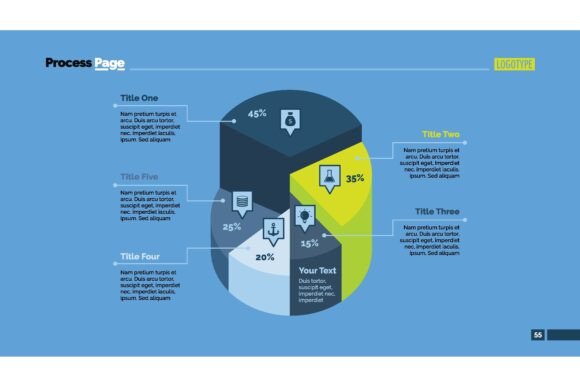
The structured yet flexible architecture makes this much more than a static template. Think of it as a visual framework where your specific data becomes the hero. Bar charts, process flows, percentage callouts, and timeline markers all live within an organized grid that maintains consistent spacing whether you're building a five-slide summary or a thirty-page investor deck. That consistency is the secret ingredient most do-it-yourself infographics miss—when viewers subconsciously register aligned edges and proportional spacing, they trust the content more.
Where Clean Data Visualization Makes the Biggest Difference
Business Infographic Template V2 shines brightest in environments where complex information meets time-pressed audiences. You know the scenario: a conference room where decision-makers are checking phones under the table, or a virtual meeting where half the attendees have seven other tabs open. In those moments, your visual aids need to work harder than your spoken words.
For executives and managers preparing internal reports, the template eliminates the afternoon wasted nudging boxes around in presentation software. A monthly performance dashboard, a departmental budget breakdown, or a project milestone tracker comes together in minutes rather than hours. The well-organized layer structure means you can swap in fresh data each reporting period without accidentally shifting a carefully positioned element. Over time, your team develops a recognizable visual cadence—stakeholders learn where to look for the key number, the trend arrow, the comparison benchmark.
Business analysts will appreciate how the template handles multi-variable comparisons without falling into the trap of cramming everything onto one impossibly dense slide. The design encourages thoughtful segmentation: perhaps a top-level summary infographic followed by supporting breakdowns that maintain the same visual grammar. When you export portions as standalone graphics for an emailed summary or a printed handout, each piece feels complete rather than orphaned from a larger deck.
Marketing teams working on case studies, white papers, or client-facing content find another sweet spot. The designs bridge that tricky gap between corporate professionalism and engaging visual storytelling. A customer success timeline, a before-and-after metrics comparison, or a service process diagram all benefit from the template's ability to make structured information feel approachable. The open source fonts ensure brand consistency across distributed teams—everyone from your senior designer to your freelance contractor can access the exact same typefaces without hunting down licenses.
Small business owners and entrepreneurs get particular value here. When you don't have a dedicated design team but need to present to potential investors, partners, or premium clients, Business Infographic Template V2 provides a professional starting point that doesn't scream "template." With the included .Fig, .Ai, .Eps, and .Svg formats, you can start in whichever design environment you're most comfortable with, then hand off to a freelancer for fine-tuning if needed. The full file format flexibility means no conversion headaches or quality loss when moving between applications.
Building Brand Consistency Through Thoughtful Visual Hierarchy
Visual hierarchy isn't just a design buzzword—it's the difference between your audience remembering the headline statistic or walking away with a vague impression of "some numbers." Business Infographic Template V2 handles hierarchy through deliberate scale relationships, weight contrast, and strategic color application. The largest element on any layout is always the most important takeaway. Secondary data points recede appropriately without disappearing. Supporting context sits at a glance-and-return level, available when viewers want deeper detail but never competing with the core message.
This layered approach to information density has a direct impact on audience engagement. When viewers can scan an infographic in five seconds and grasp the central point, they're far more likely to invest the additional thirty seconds needed to absorb the supporting evidence. The alternative—forcing everyone to work through every detail equally—results in the mental equivalent of a shrug. The template's designs recognize that modern audiences are sophisticated scanners before they become deep readers.
Professionalism emerges from restraint. Look closely at any of the three design variations and you'll notice what isn't there: no gratuitous drop shadows, no rainbow color explosions, no icons used purely as decoration. Every visual decision traces back to an information-communication purpose. That restraint builds credibility. Clients and stakeholders may not consciously articulate why your materials feel more authoritative, but their trust in the data increases when presentation matches substance.
For brand-focused projects, the template's customization ease allows you to swap in your specific color palette, logo placement, and preferred iconography style without fighting against an overly opinionated base design. The neat layer organization mentioned in the specifications isn't marketing language—it translates to practical time savings when you need to recolor thirty elements across four pages before a morning meeting. Well-named layers and logical grouping make bulk edits predictable rather than a test of patience.
Practical Considerations for Real-World Projects
Choosing the right infographic template involves more than aesthetic preference. Start by assessing the complexity of the data you need to visualize. If you're working with simple trend lines and three-bullet summaries, the template's cleaner variations will serve you best. For denser comparisons with multiple variable sets, the variation with stronger structural containers helps prevent visual chaos. Most professionals find value in keeping all three designs available, selecting the appropriate starting point per project rather than forcing every dataset into a single layout philosophy.
File format choice matters more than many realize. The .Fig format is ideal for collaborative teams working in Figma, where real-time feedback and cloud-based access simplify review cycles. Adobe Illustrator users gravitate toward the .Ai format for its native compatibility with vector editing workflows. The .Svg format opens doors for web-based implementations, letting developers integrate infographic elements directly into digital reports or interactive dashboards without rasterizing quality loss. Having all four formats means you're never locked into a single ecosystem.
A practical note about the included images: the preview thumbnails and sample photography shown in product demonstrations serve placement purposes only. You'll need to supply your own imagery where photographs appear in the layouts. This is standard practice across the design template industry and actually works in your favor—you control the authenticity of visuals rather than settling for generic stock faces that might appear in a competitor's materials.
Testing font pairings within the template environment is straightforward since the open source fonts install freely on any machine. Experiment with keeping the headline typeface consistent across all touchpoints while introducing subtle variety in caption or label treatments. The sans serif foundation of the designs pairs well with minimalist body text or even a restrained serif for reports that need a more editorial feel. Pay attention to how different weight combinations affect readability when projected versus printed—what looks crisp on your monitor at 100% zoom might need adjustment when scaled to presentation room dimensions.
Commercial licensing considerations are refreshingly simple here. Since the template uses open source fonts and provides full editable formats, you avoid the tangled web of font licensing restrictions that complicate many premium design assets. This matters especially for agencies creating deliverables for multiple clients, content creators producing monetized materials, and businesses with geographically distributed teams. You can confidently share working files knowing that font access won't become a bottleneck.
Making Your Data Memorable Without Sacrificing Accuracy
The ultimate test of any infographic is whether viewers remember the information a week later. Business Infographic Template V2 supports memorability through visual distinctiveness without exaggeration. Color-coded category systems help viewers form mental associations. Consistent icon styles build a visual vocabulary that carries across multiple slides or pages. Spacing patterns create a reading rhythm that feels natural rather than forced.
At the same time, the template never distorts data for the sake of drama. Chart scales remain proportional. Percentage callouts retain mathematical accuracy. Comparative bar lengths reflect genuine ratios. This integrity matters deeply in business contexts where decisions ride on the numbers presented. An infographic that prioritizes flash over accuracy might earn a moment's admiration but erodes long-term credibility. The designs here understand that your reputation is attached to every data point you publish.
For content creators and bloggers incorporating infographics into long-form articles or social media campaigns, the template's export flexibility proves especially valuable. Create the full detailed version for your website, extract a simplified square crop for Instagram, adapt a horizontal banner version for LinkedIn articles, and generate a vertical summary for Pinterest—all from the same master file. The clean vector foundations ensure crisp output at any dimension, whether viewed on a phone screen or a conference display.
Publishers and editorial teams working under deadline pressure will appreciate how the structured designs reduce decision fatigue. Instead of debating layout options for every quarterly report or annual summary, your team establishes the template as a visual baseline. Customization focuses on data updates and relevant imagery swaps rather than reinventing structural decisions. Over time, your audience develops visual recognition—they know that when they see your infographic style, substantive information follows. That brand equity compounds with every well-executed publication.
Crafters and hobbyists running Etsy shops or teaching online courses might seem distant from corporate infographic needs, but the template serves these audiences equally well. A workshop handout explaining a multi-step technique, a product comparison guide for your shop listings, or a visual syllabus for an online class all benefit from professional data visualization. The approachable design variations mean your materials look polished without feeling impersonal—customers connect with content that respects their time through clear information design.
Moving From Template Selection to Finished Deliverable
Getting started follows a natural progression. Open all three design variations and spend a few minutes with each, imagining your specific data placed within the layouts. Notice which variation makes your key metrics feel most at home. Export that version in your preferred format and begin a rough placement pass—don't polish yet, just drop in your actual numbers, labels, and rough color adjustments. Live with that draft for a day, then revisit with fresh eyes to refine spacing, alignment, and emphasis.
The template's compatibility with popular design software means you can move between tools as project needs evolve. Start in Figma for team collaboration during initial layout. Move to Illustrator for precise refinement before final export. Use the SVG version as a web-ready fallback or a starting point for interactive implementations. Each format carries the same design integrity, so your infographic looks consistent regardless of which software path you choose.
Ultimately, Business Infographic Template V2 succeeds because it understands its role in your workflow. It's not here to make design decisions for you or to substitute for genuine data analysis. It's a carefully constructed starting point that handles the visual heavy lifting—the spacing systems, the typographic hierarchy, the color relationships, the balanced compositions—so you can focus on what matters most: the story your numbers tell and the decisions they inform. When your audience walks away with both clarity and confidence, the template has done its job. Everything else is just decoration.